Edit chart
Loading graph
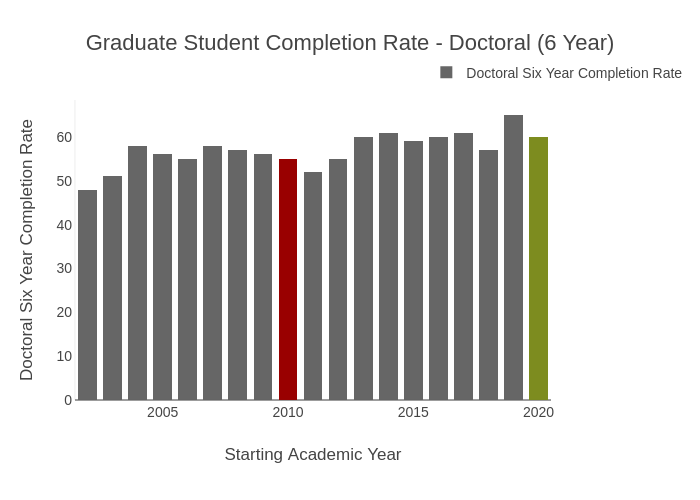
Provostncstate's interactive graph and data of "Graduate Student Completion Rate - Doctoral (6 Year)" is a stacked bar chart, showing Doctoral Six Year Completion Rate, Baseline, Goal; with Starting Academic Year in the x-axis and Doctoral Six Year Completion Rate in the y-axis.. The x-axis shows values from 2001.5 to 2020.5. The y-axis shows values from 0 to 68.42105263157895.